"... In recent weeks, the U.S. stock market has been characterized by an overvalued, overbought, overbullish, rising-yields syndrome that has historically been hostile to stocks. Last week, the situation became much more pointed. Past instances have been associated with such uniformly negative outcomes that the current situation has to be accompanied by the word "warning."
The following set of conditions is one way to capture the basic "overvalued, overbought, overbullish, rising-yields" syndrome:
1) S&P 500 more than 8% above its 52 week (exponential) average
2) S&P 500 more than 50% above its 4-year low
3) Shiller P/E greater than 18
4) 10-year Treasury yield higher than 6 months earlier
5) Advisory bullishness > 47%, with bearishness < 27% (Investor's Intelligence)
[These are observationally equivalent to criteria I noted in the July 16, 2007 comment, A Who's Who of Awful Times to Invest. The Shiller P/E is used in place of the price/peak earnings ratio (as the latter can be corrupted when prior peak earnings reflect unusually elevated profit margins). Also, it's sufficient for the market to have advanced substantially from its 4-year low, regardless of whether that advance represents a 4-year high. I've added elevated bullish sentiment with a 20 point spread to capture the "overbullish" part of the syndrome, which doesn't change the set of warnings, but narrows the number of weeks at each peak to the most extreme observations].
The historical instances corresponding to these conditions are as follows:
December 1972 - January 1973 (followed by a 48% collapse over the next 21 months)
August - September 1987 (followed by a 34% plunge over the following 3 months)
July 1998 (followed abruptly by an 18% loss over the following 3 months)
July 1999 (followed by a 12% market loss over the next 3 months)
January 2000 (followed by a spike 10% loss over the next 6 weeks)
March 2000 (followed by a spike loss of 12% over 3 weeks, and a 49% loss into 2002)
July 2007 (followed by a 57% market plunge over the following 21 months)
January 2010 (followed by a 7% "air pocket" loss over the next 4 weeks)
April 2010 (followed by a 17% market loss over the following 3 months)
December 2010
Since Investor's Intelligence data is not available prior to the mid-1960's, we get a few additional observations if we drop the "overbullish" criteria in prior years. These include December 1961 (followed by a 28% market loss over the following 6 months) and a few quick market plunges in the mid-1950's. I've excluded these in the list above because we don't have associated sentiment readings.
It's not pleasant to adhere to our discipline here, but I believe that it is essential to do so, because conditions like these are often where it matters most, despite the discomfort. We've lost several percent in the Growth Fund in an advancing market, reflecting a tendency of investors to abandon stable investments in preference for the "risk trade" in highly cyclical stocks, as well as option time decay in an environment where defense is seen as unnecessary. The market's recent embrace of the "risk trade" can be traced to the apparent endorsement of risk-taking by the Fed. Still, it's wise to remember that while Fed Chairmen have proven to be apt encouragers of bubbles over the short term, the "Greenspan put" certainly didn't avoid the 2000-2002 mauling, nor did the "Bernanke put" avoid the even deeper 2007-2009 plunge. The only put options that investors can rely on here are the contractual kind.
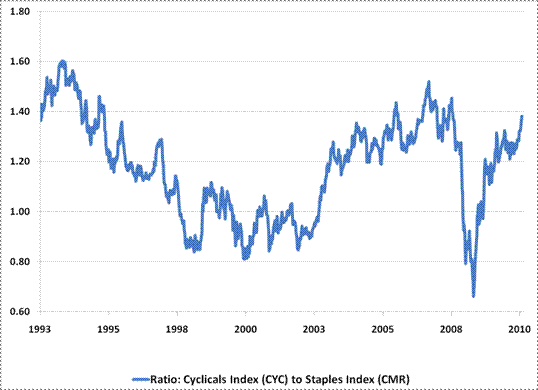
"...From a stock selection perspective, it is striking how extended the stocks of cyclical companies have now become, relative to more stable companies. This is true both on the basis of price and valuation. Cyclical stocks include companies such as Alcoa, Citigroup, Caterpillar, CSX, DuPont, Deere, Ford, FedEx, Goodyear, Hewlett Packard, International Paper, Southwest Airlines, 3M, Sears, United Technologies, and Whirlpool, among others. Staples include companies like Abbott Labs, ADP, Colgate Palmolive, Disney, General Mills, Johnson and Johnson, Kimberly Clark, Coca-Cola, McDonalds, Merck, Pepsico, Pfizer, Safeway, Walgreens, and Wal-Mart, among others.
The following chart (courtesy of Bill Hester) presents the ratio of the cyclicals index (CYC) versus the staples index (CMR). It's notable that the most recent spike in this ratio coincided with Bernanke's initial announcement of QE2. Cyclicals are now nearly as overextended relative to staples as they were at the 2007 peak. As one would infer from the word "cyclical," these companies are unusually prone to volatility.
Market Climate
As of last week, the Market Climate for stocks was characterized by an overvalued, overbought, overbullish, rising-yields syndrome that has historically been hostile for stocks. Clearly, we can't observe what the outcome will be in this particular instance. We can't rule out the possibility that investors will continue to speculate on the hope of ever larger deficits and some further combination of illegal or irresponsible Fed actions. From our standpoint, the return/risk profile of the equity market is the most negative that we ever observe historically, so we are willing to speculate neither on the hope for government wisdom, nor on the hope for government recklessness. Investors who are convinced that monetary and fiscal actions will drive the market ever higher can easily offset our hedges by establishing exposure to the S&P 500 or more speculative alternatives. What I can't do on behalf of those investors is violate our discipline and take a speculative exposure in an environment where the historical evidence indicates an extraordinarily hostile return-to-risk tradeoff.
Our objective remains to significantly outperform our benchmarks over the complete market cycle, with smaller periodic losses. I recognize that it has not been satisfactory simply to lose less than the S&P, but with smaller drawdowns, since the 2007 peak. Still, it would be an understatement to say this has been an unusual cycle. Given the broader set of Market Climates we have defined, I am confident that we will periodically observe more favorable market environments - possibly even in the coming months, without major changes in market valuation - where we will be able to accept risk in the expectation of positive returns. From my perspective, this is emphatically not one of them.
The Strategic Growth Fund remains fully hedged here. Given the hostile Market Climate, and the fact that individual stocks can decline indiscriminately from overvalued, overbought, overbullish, rising-yield peaks, we are also carrying a staggered strike hedge (which moves our put option strikes closer to "at-the-money" levels). Though we expect to close that position at the point where the return/risk profile of the market improves or implied option volatility increases significantly, the last thing we want is to be inadequately hedged in an indiscriminate selloff because we believed our stocks did not have much "beta." Strategic International Equity is also largely hedged, and we continue to establish corresponding hedges as we add new equity positions to the Fund.
In bonds, the Market Climate last week was characterized by slightly favorable yield levels, but unfavorable yield pressures. In response to a sharp spike in Treasury yields, we increased the Strategic Total Return Fund's duration to about 2.5 years from just under 1 year. This clearly isn't an aggressive shift by any means, and may only be a brief change, but we'll respond to the evidence as it emerges. I suspect that it may take longer for deficit spending and monetary ease to result in inflation than the market presently appears to be pricing in.
Based on historical experience, we are likely to observe a clear acceleration of inflation only after short-term interest rates increase by about 15-20 basis points over a 6-month period, and those pressures will be worse if long-term rates are also rising (at that point, attempts to reduce short rates through Fed easing may have the paradoxical effect of increasing inflation expectations). For now, I continue to believe that the inflation thesis is most likely correct long-term, but that this doesn't necessarily translate into persistent inflation or interest rate pressures over the short or intermediate term. We continue to hold about 1% of assets in precious metals, about 1% in foreign currencies, and about 2% in utility shares.
http://www.hussman.net/wmc/wmc101213.htm
No comments:
Post a Comment