Chart In Focus
ECB’s Shrinking Balance Sheet
 |
February 07, 2013
The news this week out of Europe has to do with upcoming elections in Italy, and what that might mean for the future of the euro. But few news stories are covering the really important development in Europe, which is the shrinking size of the European Central Bank (ECB) balance sheet.
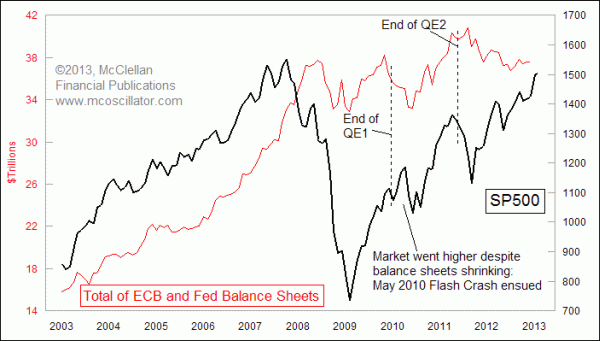
The U.S. Federal Reserve has been doing its part to inflate the banking system, most recently with its announced program to purchase $40 billion per month of mortgage backed securities (MBS). But the Fed's total balance sheet size of $3.02 trillion pales in comparison to the size of the ECB's balance sheet, which equates to $26 trillion as of December 2012. While the Fed's holdings have increased 6.7% since the September 2012 Jackson Hole conference, the shrinkage of the ECB's balance sheet over that same time period has more than made up for the Fed's money printing.
The reason why this is important is because there is a very strong correlation between the combined size of the ECB and Fed balance sheets and the movements of the world's stock markets. When the balance sheets are growing, that is overwhelmingly a bullish factor for stock prices.
When balance sheets stop growing or start shrinking, it is a little bit more complicated. Past episodes of shrinking balance sheets in 2008, 2010, and 2011 all were associated with big drops in the SP500 and other indices. As 2013 gets underway, the SP500 is continuing higher and challenging its 2007 all-time high, but it is doing so in an environment when the combined balance sheet size has not been rising.
This creates a bit of an analytical quandary. Is this stock market strength with no balance sheet rise a sign that the stock market and the world economy are finally able to proceed on their own, and without central bank stimulus? Or is this just another example of what we saw in early 2010, when the stock market continued higher for a few months after the faucet was turned off?
In that 2010 example, what resulted was the Flash Crash in May 2010, and a lower bottom in July 2010, after which the stock market started upward again when the Fed announced its QE2 program, and when the ECB jumped in with similar monetary stimulus. So to bet on the hypothesis that the stock market can now fly on its own is to say "it's different this time", which is one of the more dangerous phrases for investors to ever utter.
Tom McClellan
Editor, The McClellan Market Report
www.mcoscillator.com
(253) 581-4889
Related Charts
|
|
The McClellan Chart In Focus is a weekly technical analysis lesson. You have received this message because you have subscribed to this periodic email, to one of our market reports, or requested information on our services in the past. If you were forwarded this by a friend, you can subscribe here no strings attached. We don't share your email address with third parties or bombard you with marketing.
Our mailing address is:
McClellan Financial Publications
P.O. Box 39779
Lakewood, WA 98496-3779
Our telephone:
(253) 581-4889
Analysis is derived from data believed to be accurate, but such accuracy or completeness cannot be guaranteed. It should not be assumed that such analysis, past or future, will be profitable or will equal past performance or guarantee future performance or trends. All trading and investment decisions are the sole responsibility of the reader. Inclusion of information about managed accounts program positions and other information is not intended as any type of recommendation, nor solicitation. We reserve the right to refuse service to anyone for any reason. The principals of McClellan Financial Publications, Inc. may have open positions in the markets covered.
Copyright © 2013 McClellan Financial Publications All rights reserved.
Feel free to forward this email to friends (intact).
Please ask if you wish to re-publish our words or our charts. We are usually happy to accommodate.
|


No comments:
Post a Comment