"...our measures of leading economic pressures have indicated the likelihood of an oncoming U.S. recession. Our view is based on the analysis of leading/coincident/lagging indicators (see Leading Indicators and the Risk of a Blindside Recession) as well as more statistical signal processing methods that extract "unobserved components" from noisy data (see the note on extracting economic signals in Do I Feel Lucky?). As Lakshman Achuthan at the ECRIhas noted on the basis of different but related evidence, the verdict has been in for a while. The interim has been little more than waiting for the coincident data to catch up to the leading evidence that is already in place."
"This wait is by no means over. As Achuthan has observed, economic data such as GDP and employment data are heavily revised over time. Very often, the first real-time negative GDP print occurs about two quarters after the recession actually begins. It is only later that the data are revised to show an earlier downturn. For that reason, it's important to pay attention to the joint action of numerous economic data points, rather than selecting any specific indicator as an "acid test." The joint evidence suggests that the U.S. economy has entered a recession that will later be marked as having started here and now."
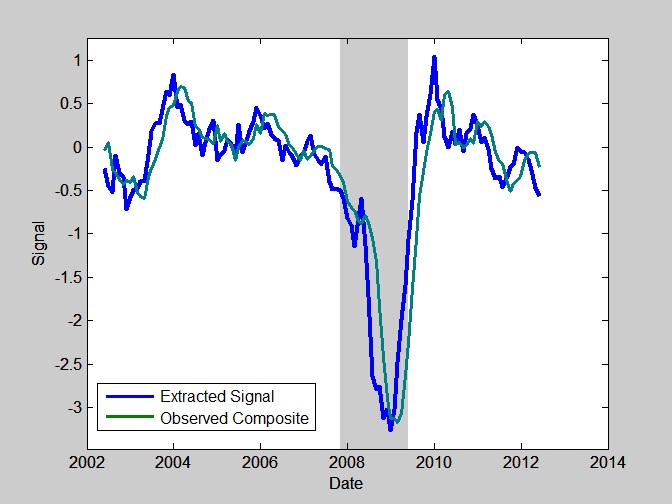
"The following chart shows the most leading economic component (blue) that we infer from a broad composite of economic indicators. This component has a lead of several months, relative to broadly observed economic data. Importantly, even the observable data has now predictably turned down, as evidenced for example by the "surprising" weakness in the Philly Fed data last week. We expect further weakening in employment data, coupled with an abrupt dropoff in industrial production and new orders."
"Once again, the weakness developing in the most leading components of U.S. data closely reflects what we're already seeing in European data. Last week, Markit reported that European output continues in its steepest contraction since 2009. The path of the Flash Eurozone Purchasing Managers Index (PMI) gives a fairly good indication of what we're likely to observe in less-timely GDP figures as they are released in the coming months. Meanwhile the HSBC China PMI has also dropped below the 50 level that distinguishes expansion from contraction, with the China Manufacturing Output Index falling to 49.1, and the China Manufacturing PMI falling to 48.1."
..."Since we try to align our investment exposure with the return/risk that we estimate at each point in time, we really don't a need to make specific predictions, other than to frame our position within what we see as a larger context. Still, my opinion aligns fairly well with what veteran analyst Richard Russell observed last week: "I'm fairly convinced that this is a legitimate primary bear market. And it will end the way all major bear markets end -- with good stocks being tossed into the market for whatever price they may bring. The good stocks will be sold last, because there will, at least, be a market for them. They will sell below known value."
Importantly, when Russell says "below known value" he means "below levels that investors presently find familiar" - not valuations that are particularly unusual from the standpoint of long-term historical experience. Russell puts the likely downside from here in a fairly wide range that works out to between 28%-56% lower. Given that our own estimates of "fair value" are in the 850-950 range for the S&P 500, and we certainly can't rule out an overshoot (which is typical historically), Russell's range isn't particularly extreme. At the high end of Russell's range, we estimate that the 10-year projected return for the S&P 500 would be about 9% annually, which is still below the historical norm. At the low end of the range, the 10-year projected return would be about 14.7%, which would be more unusual, but still well below the projected returns that were available between 1973-1984 and the bulk of the period between 1940-1954. It's not a narrow range by any means, but it isn't kind to the notion that the worst potential downside for the market is limited to 10-15%"
http://www.hussman.net/wmc/wmc120625.htm
No comments:
Post a Comment