Pages

Thursday, June 9, 2011

Merk Commentary: Bernanke - It's Complicated!

Axel Merk, Portfolio Manager, Merk Funds
June 8, 2011

Get ready for more money to be printed – this time not to subsidize an overly indebted American consumer, but to stem against the credit destruction caused by the Federal Reserve (Fed) itself. Tuesday evening at the International Monetary Conference in Atlanta, J.P. Morgan CEO Jamie Dimon gave a laundry list of changes that have already incurred in the banking system, including
  • No more Special Investment Vehicles (SIVs)
  • No more sub-prime, no more “Alt-A” mortgages
  • No more CDOs
  • Higher underwriting standards
On top of these changes, the Fed now wants to introduce 300 new regulations. Has anyone at the Fed studied what impact these regulations will have on credit?
A fair question, to which Fed Chairman Bernanke stumbled, “it’s Complicated!” He then admitted that no such study has been undertaken and that, indeed, tradeoffs have to be made and that the impact on credit will have to be carefully monitored.

For practical purposes, we believe we should expect more easy money; Dimon is correct that headwinds caused by upcoming regulations, as well as those already introduced since the onset of the financial crisis, are enormous. To keep the economy moving ahead nonetheless, more money may need to be printed than even the Fed expects.

Unfortunately Bernanke misses the obvious: if it is so complicated, make it simple. Keep It Simple Stupid is a paradigm that should not only apply to monetary policy, but also to regulatory policy. In our humble opinion, regardless of regulation imposed, bankers will remain one step ahead of regulators. They simply have greater resources to find loopholes – introducing fancy terms like “macroprudential supervision of financial institutions” won’t change that, either.

Regulators should embrace the challenge by working with market forces, rather than over-regulating the system, thereby stifling economic growth. There are simple levers that can be employed. For example, we believe that speculators should not be prevented from making dumb decisions, but processes should be in place that dumb decisions do not cause systemic risks. Such a policy is fairly straightforward to implement by imposing margin requirements on leveraged bets. Add transparency and mark-to-market accounting and you have already achieved a more stable system, with incentives to use less leverage. There are additional measures that can be implemented to force banks to de-leverage their balance sheet should the market, rather than regulators, believe banks engage in behavior that’s too risky (e.g. by requiring banks to issue substantial amounts of staggered, long-term subordinate debt; should the cost of refinancing be unattractive, banks need to shrink their balance sheets, but can do so in an orderly fashion).

Some concluded from Bernanke’s talk that there is no additional round of quantitative easing, a QE3, in sight. Our view is that the Fed is simply baffled that all the money printed has not worked, and will wait and hope… for now. But because things are so complicated, sprinkling more money on the problem may be the weapon of choice in the not too distant future...

Wednesday, June 8, 2011

...KWN Interview with Jim Sinclair

With continued volatility in gold and silver, today King World News interviewed the legendary Jim Sinclair to get his take on the markets. Sinclair surprised KWN by discussing a price target for gold that to some would seem unimaginable. When asked about trading for gold this summer Sinclair stated, “I think most of your analysis of secular trends will look and say no, no, summer time doldrums nothing happens. Well we could have something very significant happen and for a very clear reason. It’s becoming obvious even to our talking heads that this great recovery which we’ve questioned for a considerable period of time is in fact more in people’s minds than in reality. The economy is turning down again and turning down hard, there’s no question about that.”

Sinclair continues:

“Quantitive easing is the only tool that the Fed has had available to them. The Fed has pumped in trillions of dollars and the result of that pump-priming in the monetary sense has been only at best a modest recovery, and certainly making trillionaires out of some bankers, billionaires out of many of them.

We’ve come to a point now where if QE were to be stopped, you would see an implosion in the general equity markets...And yes gold would go down, the market would go down hard. The dollar would go up slightly to begin, but then fall back down again as the management of the economy was seen to have been ineffective and inefficient.

Gold would then start moving back up again and I think if QE was to cease, the recovery on gold from a modest reaction would be multiples upon multiples of that reaction and would lead the way to Harry’s $2,400, to Alf’s $3,000 to $6,000.

You can’t stop quantitive easing. If you stop quantitive easing the stock market will return to its recent low or lower. That alone by its impact on decision making will cause an economic implosion. We’re tied into this monetary stimulation, there is no way out of monetary stimulation. If there was any attempt to get out of monetary stimulation it would cause an economic accident which would require central banks to go right back where they were. That would be again, loss of control...

So because loss of control could be this summer’s event, the potential is gold could have a very serious run to the upside this summer.

If QE is continued then the basic uptrend in gold now so solidly intact, will continue in its power uptrend, and you could expect a stronger gold market this summer. I’d be very careful about seasonality in gold...There’s every possibility that gold could put on a summer rally of distinction.

...A cessation of quantitive easing could open up the black hole of Calcutta for the general equities markets in a way that very few really understand. You could see thousands of points taken off that market in a very short period of time.

The only way to overcome that would be by whatever name you called it to start the QE again. That would be indicative of a total loss of control. So the question is what would the price of gold be if it became publicly undeniable that control of the economic functions for the believers no longer resided in Federal Reserves and central banks?

The answer is gold would do what it historically attempts to do and that is to balance the balance sheet of the United States of America’s external foreign debt...and when we do the calculations we come up with a figure that is in excess of $12,500.”

In my opinion this is one of the most powerful interviews Jim Sinclair has ever done for King World News because he discusses upside targets for gold that are far in excess of his original $1,650 price target, and he also explains quite clearly why those levels will be achieved.

The KWN audio interview with Jim Sinclair will be available shortly and you can listen to it by CLICKING HERE.

Tuesday, June 7, 2011

With all of this negative analysis, could it be a contrarian indicator?


The S&P 500’s decline has now stretched to five weeks. This is the first five week decline since June and July of 2008. The S&P 500, Dow, and NASDAQ all closed below their respective 4 and 12 week exponential moving averages. This signals that the intermediate term trend in the market, until the averages close above those moving averages, is now negative. The monthly bias remains positive as the markets remain above their 12 and 20 month moving averages. 
The daily bias on the markets is also negative as the markets closed Friday at six week lows. The selloff on Friday was sparked by the morning employment data. Nonfarm payrolls for May climbed by 54,000, which is less that the 169,000 additions that had been expected. While the employment data was weaker than expected, the ISM non-manufacturing survey was better than expected. The S&P 500 was off 2.2% for the week after declining 1.35% in May.
49% of the stocks in the S&P 500 are either basing or advancing. Only 46% in the broader markets stocks are technically sound. Prudence is key here. In this environment you have just a coin flips chance of picking winners. Make sure you pay attention to the charts of the stocks in your portfolio. There is a rotation out of past winners and investors are reducing the overall risk of their portfolios.
The recent economic data and seasonal factors have led investors to question the strength of the global economy. The market broke above a recent down trend just on Tuesday of last week, breaking the cycle of lower highs and lower lows. That abruptly changed Wednesday. The market sold off sharply in response to weaker-than-expected ADP employment data. All market technical readings on Tuesday were extremely positive. That story completely reversed on Wednesday. The sell-off continued Friday. The action of the market has been erratic and underscores how confused investors are at the moment. To see such strong action in the market early last week followed by aggressive selling is cause for alarm.
For now the bears are in control of the market. The S&P is still up for the year. However, the technical readings of the market have deteriorated significantly over the past few weeks. The key levels of support are 1294 S&P 500, 12,090 Dow, and 2705 NASDAQ. If these levels are broken the intermediate term trend will be negative and the sell-off will likely accelerate. 
We should use rallies in names that are deteriorating to sell stocks. 1294 on the S&P 500 marks a 62% retracement of the March low/May high rally. The swiftness of the selling since the high in May is worrisome and signals that rallies should be used to reduce the risk profile of portfolios. 
-----------------------------

S&P 500 Breaks Down

John Nyaradi 
Major indexes decined today and now the S&P 500 is on a point and figure "sell" signal, the last of the major indexes to hit this point.  We now are at lows not seen since mid-March. 
Downside price objective is now 1200 with no visible support until 1250. 
 S&P 500 Index Chart (SPY)

chart courtesy of www.stockcharts.com 


This is the last major index to go on a "sell" signal but all are still within the context of a longer term bull market denoted by the blue Bullish Support line at approximately 1080 on the S&P 500.

Decliners led advancers by 4 to 1 and today's session was the fourth losing day in a row and the beginning of the sixth week of losses for major indexes.

Tomorrow we hear from Dr. Bernanke regarding his assessment and for any hints of "QE3," which is likely to be a tough sell unless things get really ugly in the economy.

Meanwhile, the Shanghai Composite is in official "correction" and even bear market territory, down 10.5% from its mid-April high and now well below its 200 Day Moving Average.

On the other side of the world, the Greece drama continued as political pressure mounts agaisnt the austerity programs, demonstrators fill Syntagma Square in Athens and the two year bond yield hovers at a whopping 22%.

At Wall Street Sector Selector we remain comfortable with our inverse ETF and put options positions. 
----------------------

Strong Futures and Euro, but Likely a 7 Day Bounce Only

Email this post Print this post
By Barry Ritholtz - June 7th, 2011, 7:48AM
I have a ton of errands to do before heading to the airport, but I wanted to get a few thoughts out beforehand:
On the back of ECB chief Jean-Claude Trichet’s comment about Greek debt rollovers, markets around the globe have turned positive rallied. The euro hit a one-month high versus the US dollar.
Stocks in Europe gained about 0.2%, while US SPX futures climbed 0.6 %. The 10-year Treasury is a mere 3 bips above 3%  mark at 3.03%
Last week’s big sell off was a 90/90 day, meaning 90% of the trading breadth and 90% of the share volume were to the downside. The playbook favors a 5 -7 day bounce, and then a resumption of the move downwards.
Here is what Lowry’s Paul Desmond, the creator of the 90/90 indicator, has said about these days:
With the evidence currently available from our measures of Supply and Demand, the probabilities favor a limited recovery rally. The 74 year history of the Lowry Analysis shows that such rallies are usually best used to sell into strength and build defensive positions. However, it is important to recognize that exceptions to the probabilities are always possible.”
We are off the recent peak by less than 6%. My best guess as to the extent of the pullback is a 7-12% move lover from the highs.  As we get more data, I’ll try to update that projection.
Be back shortly . . .
>

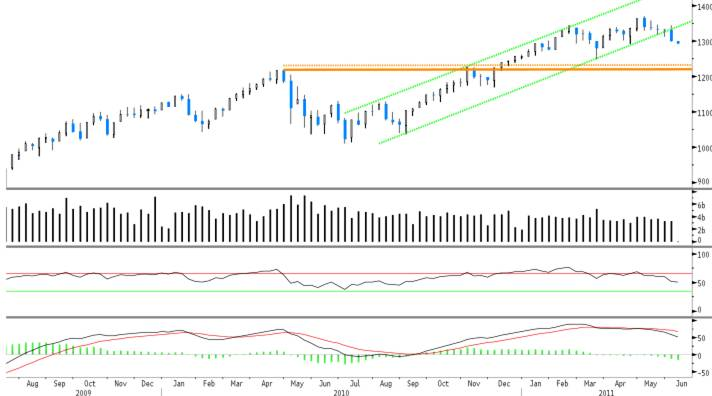
SPX Breaks its 1 year Up Channel


Chart courtesy of FusionIQ


Monday, June 6, 2011

...from Dr. John

"To a large extent, the current softening of economic conditions is really nothing more than the recrudescence of the deterioration we saw last summer. Basically, we're coming up on the can that the Fed kicked down the road when it initiated QE2. While the Fed was successful in releasing a modest amount of pent-up demand, and was certainly successful in provoking speculative activity, there was never a realistic prospect of creating a beneficial "wealth effect" for the economy as a whole. The historical evidence is emphatic that people consume off of perceived "permanent income" - not off of volatile dollars. Wealth is driven by the creation of long-term cash flows through productive investment, not by boosting the valuation of existing cash flows by encouraging speculation. There was no reason for people to take much of a permanent signal from fluctuations in a stock market that has lost more than half of its value twice in a decade (and is likely to lose a good chunk of its value again if history is of any indication).

So while the Fed has been successful in fostering speculation, further impoverishing the world's poor through commodity price increases, and subsidizing banks by driving funding costs to zero (at the expense of the risk averse and the elderly), QE2 has clearly failed from an economic standpoint. This failure is not because we haven't given it enough time, or because monetary policy works with a lag. Rather, the policy has failed because it focused on easing constraints (bank reserves, short-term interest rates) that weren't binding in the first place. Very simply, neither the Fed's policy, nor the fiscal policy initiatives to date, address the central challenge that the U.S. economy faces, which is the debt burden on households.

The salient problem in the U.S. economy isn't the precise level of already low mortgage rates. It isn't "uncertainty" about taxes or health care. The problem is that people aren't spending as they did in recent decades, because that spending was largely debt-financed, and the pressures now run in the opposite direction. We still haven't restructured mortgage debt on millions of homes that are underwater. Property values are hitting new lows. Hundreds of thousands of properties are delinquent and yet the mortgages are being carried by the banking system at face value. Banks, knowing this, are clearly reluctant to extend their balance sheets further. Government deficits of nearly 10% of GDP are presently required to cover the gap in private incomes and spending. Indeed, most of what we observe as personal income growth is attributable to transfer payments from government.

To be clear, I believe that about 90% of the economy is functioning reasonably well (in the typical range of what is experienced over an economic cycle), but 10% of it is in extreme difficulty well outside what is seen in the normal cycle, and is only floating thanks to deficit spending that is unsustainable in the long-term and increasingly under pressure in the short-term. The problem is that we measure severe recessions as declines in GDP on the order of 2% or so. Without addressing the central problem of household indebtedness and underwater mortgages, the economic growth we get may not be robust enough to avoid more frequent recessions and near-recessions."

Sunday, June 5, 2011

Jetman

Yves Rossy, dubbed “Jetman” after becoming the first man ever to fly with a jet-propelled wing, completed a historic eight-minute flight over the Grand Canyon on Saturday. According to a press release issued by Breitling, Rossy’s sponsor, the Swiss pilot completed the flight after taking off from a helicopter at 8,000 feet with his jet-propelled wing strapped to his back.

He then proceeded to fly approximately 200 feet above the rim of the Grand Canyon, steering with his body and reaching speeds of up to 190 mph during the process, before he deployed his parachute and glided down to the canyon surface.